VRA Maps
VRA Maps for Precision Variable Rate Applications
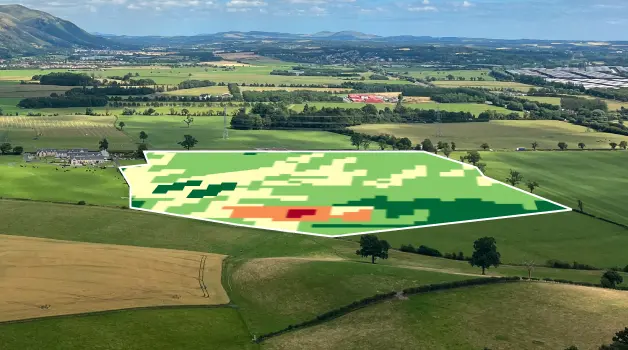
Create ready-to-use VRA maps in WHY Crop Monitoring and apply seeds, fertilizers, and crop protection just as much as needed. The system uses satellite data and field analytics to help you apply inputs at appropriate variable rates and save resources.
- 5+ vegetation indices and elevation data
- Extensive archive of historical satellite imagery
- High-quality images with up to 3m resolution
- No extra hardware required
- VRA files compatible with agricultural machinery
Why use variable rate application maps on WHY Crop Monitoring?
Boost
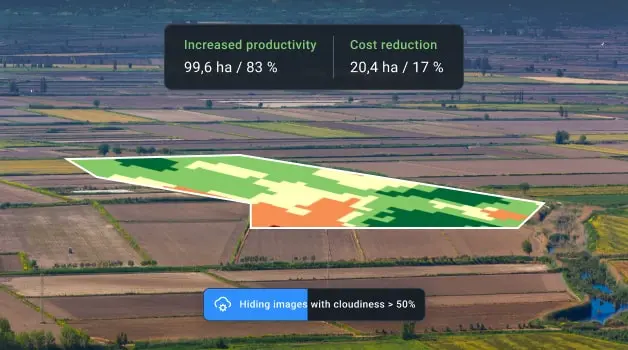
Boost crop productivity per hectare while saving on fertilizers, pesticides, seeds, and water through variable rate applications.
Boost crop productivity per hectare while saving on fertilizers, pesticides, seeds, and water through variable rate applications.
Increase
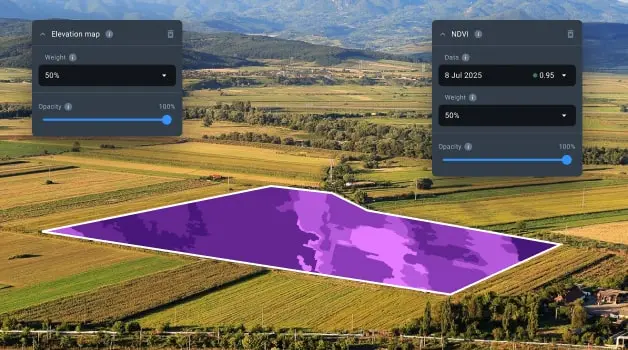
Increase application precision using different data sources for generating VRA maps: NDVI, NDMI, RECI, MSAVI, and elevations or ag machinery data.
Increase application precision using different data sources for generating VRA maps: NDVI, NDMI, RECI, MSAVI, and elevations or ag machinery data.
Detect
Detect problem areas in no time for targeted variable rate applications and other interventions.
Detect problem areas in no time for targeted variable rate applications and other interventions.
How We Use VRA Maps
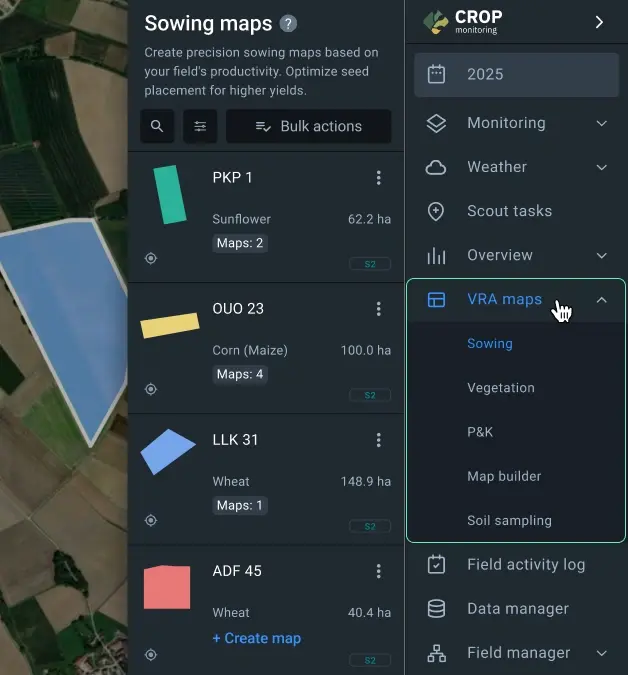
Choose the VRA map type right for your purpose
Automatically divide the field into management zones via our algorithm
Set appropriate variable application rates for each management zone
Export the variable prescription map for use in agricultural machinery
How farmers apply VRA maps from EOSDA Crop Monitoring
Optimize variable seed placement based on satellite imagery analytics
Identify stress factors in specific soybean field zones
Evaluate new field potential ahead of the growing season
Features of VRA maps on WHY Crop Monitoring explained
- What it does: Automatically splits your field into 2 to 7 zones for variable rate applications based on how productive each of them has been in past years, using historical NDVI data.
- Why it matters: Makes it easy to apply seeds and starter fertilizers at variable rates based on field productivity (e.g., using more where yields tend to be higher and less where not). As a result, you use inputs more efficiently and increase overall germination rates.
- How to use it: Select a period (from 2016 till now), set the number of zones for variable rate application, click Calculate, assign seeding rates for each zone, and export the file to your tractor.
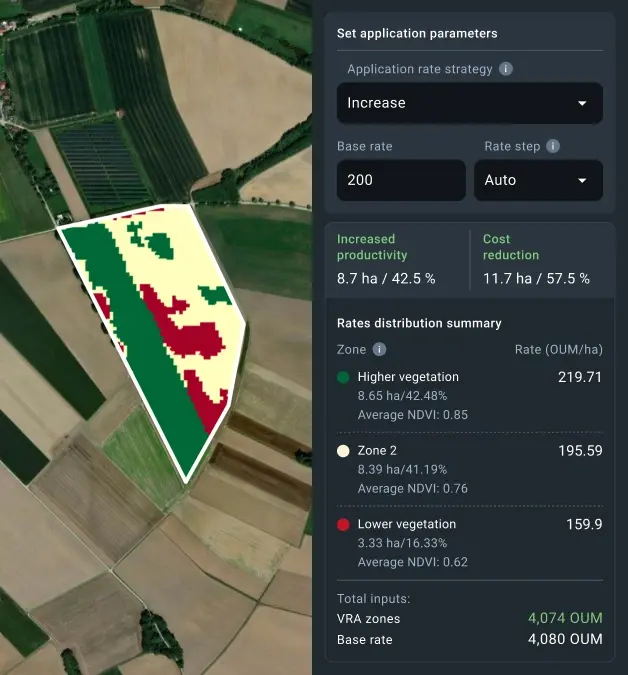
- What it does: Analyzes recent satellite images with 4 vegetation indices (NDVI, NDRE, ReCl, MSAVI) to visualize crop health and guide decisions for variable rate fertilizer/treatment applications.
Why it matters: You can make variable rate applications only where crops need them based on the index-based guidance for each type of treatment:
- nitrogen fertilization
- crop desiccation
- growth regulator application
- micronutrient application.
- How to use it: Select the field activity you want to perform at variable rates, and the system will automatically suggest the optimal settings and vegetation indices. Choose the latest cloud-free satellite image, select the number of application zones and detail level, click Calculate, assign variable application rates for each zone, and export the VRA file to your agricultural equipment
- What it does: Uses NDVI data from a specified time period to automatically divide your field into 2–7 zones for variable rate applications, depending on the past productivity of each zone.
- Why it matters: Ensures you’re not spreading phosphorus and potassium fertilizer evenly “just in case”. With the variable rate P&K application, you can focus on zones that can really pay off and reduce waste in low-demand zones.
- How to use it: Select a period at your discretion, set the number of zones, click Calculate, assign variable application rates for each zone, and export the file to your agricultural equipment.