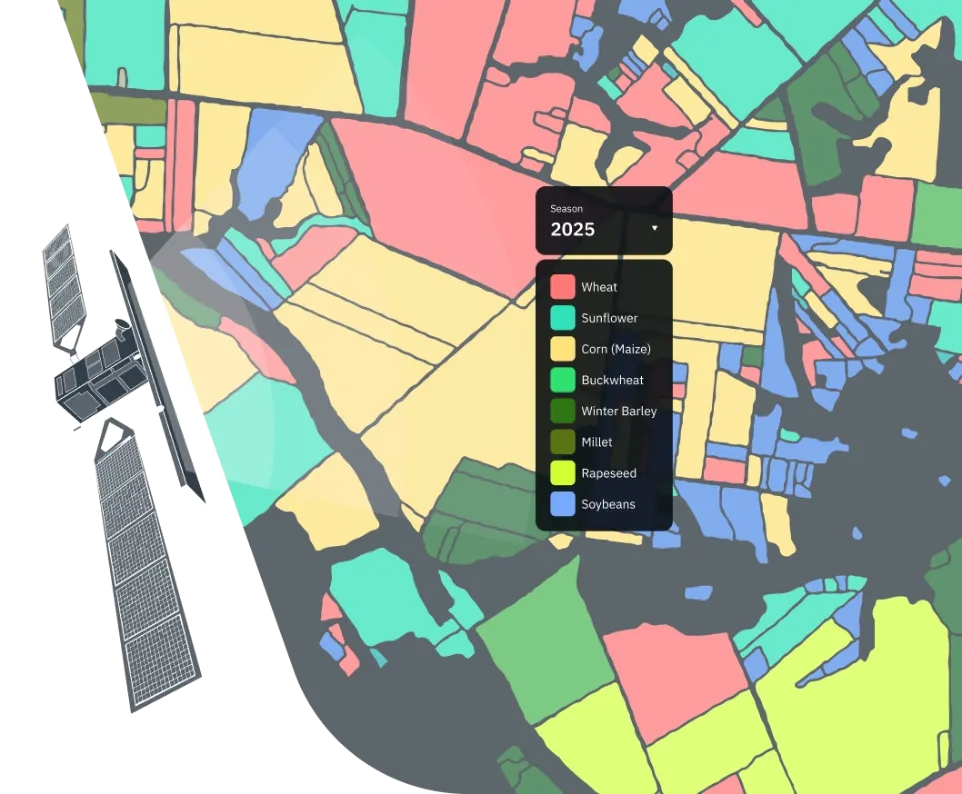
Crop classification using satellite images and analytics
EOSDA’s crop classification solution offers accurate, scalable, and fully managed satellite imagery analytics powered by AI. It helps organizations make smart, data-driven decisions across the agricultural value chain.
- Up to 90% accuracy
- API integration
- Customizable reports
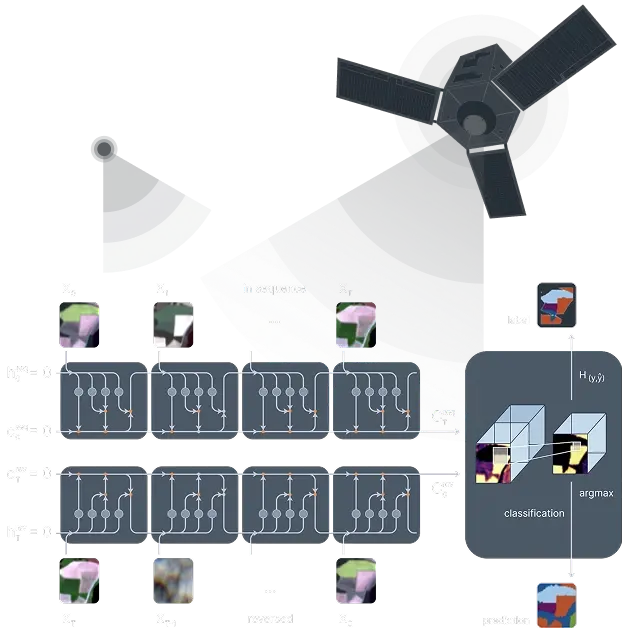
Approach and methodology of our AI-powered crop classification
Model: WHY uses a multi-level Conv-LSTM architecture that integrates spatial (CNN) and temporal (LSTM) analysis. Using a full-season time series imagery analysis, the model captures crops' spectral changes across growth stages, significantly improving detection accuracy.
Satellite data: The model uses imagery from Sentinel-2 L2A satellite, which collects data 8 spectral bands (RGB, 2 Red edge, NIR, 2 SWIR).
Crops: The model was trained on data from over 20 crop types across various countries and can be adapted to any crop if ground truth data is provided.
Accuracy: up to 90%.
Limitations: Regions with high cloud cover and fields smaller than 2 ha.
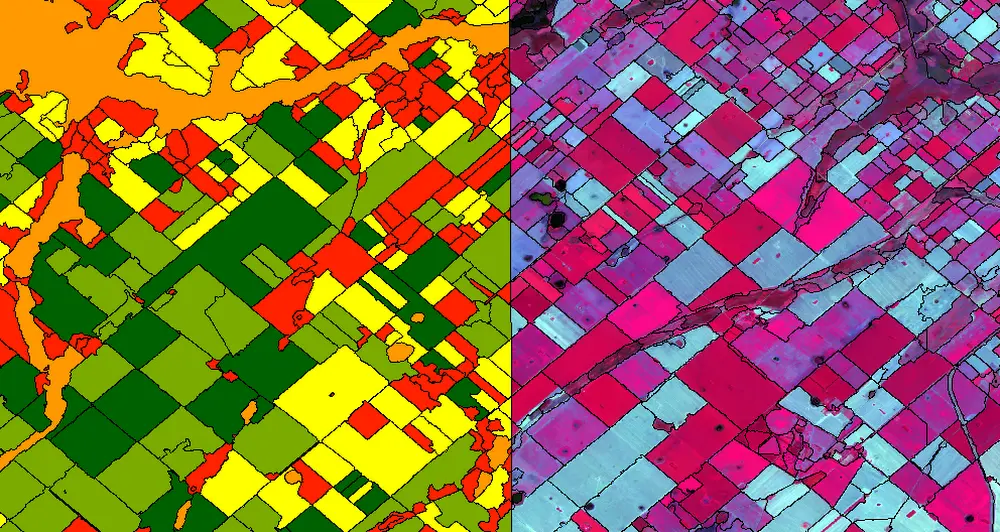
Expected project outputs and formats
- Classification raster mask limited to the AOI in GeoTIFF format.
- Vector mask with field boundaries in ESRI shapefile, GeoJSON, KML, or GPKG.
- Aggregated statistics by admin boundaries of regions, districts, etc in xlsx, ot csv.
- Analytical report or results interpretation note, if required.
- *Delivery in another format, including via API interface.